Treemap of Clark Library
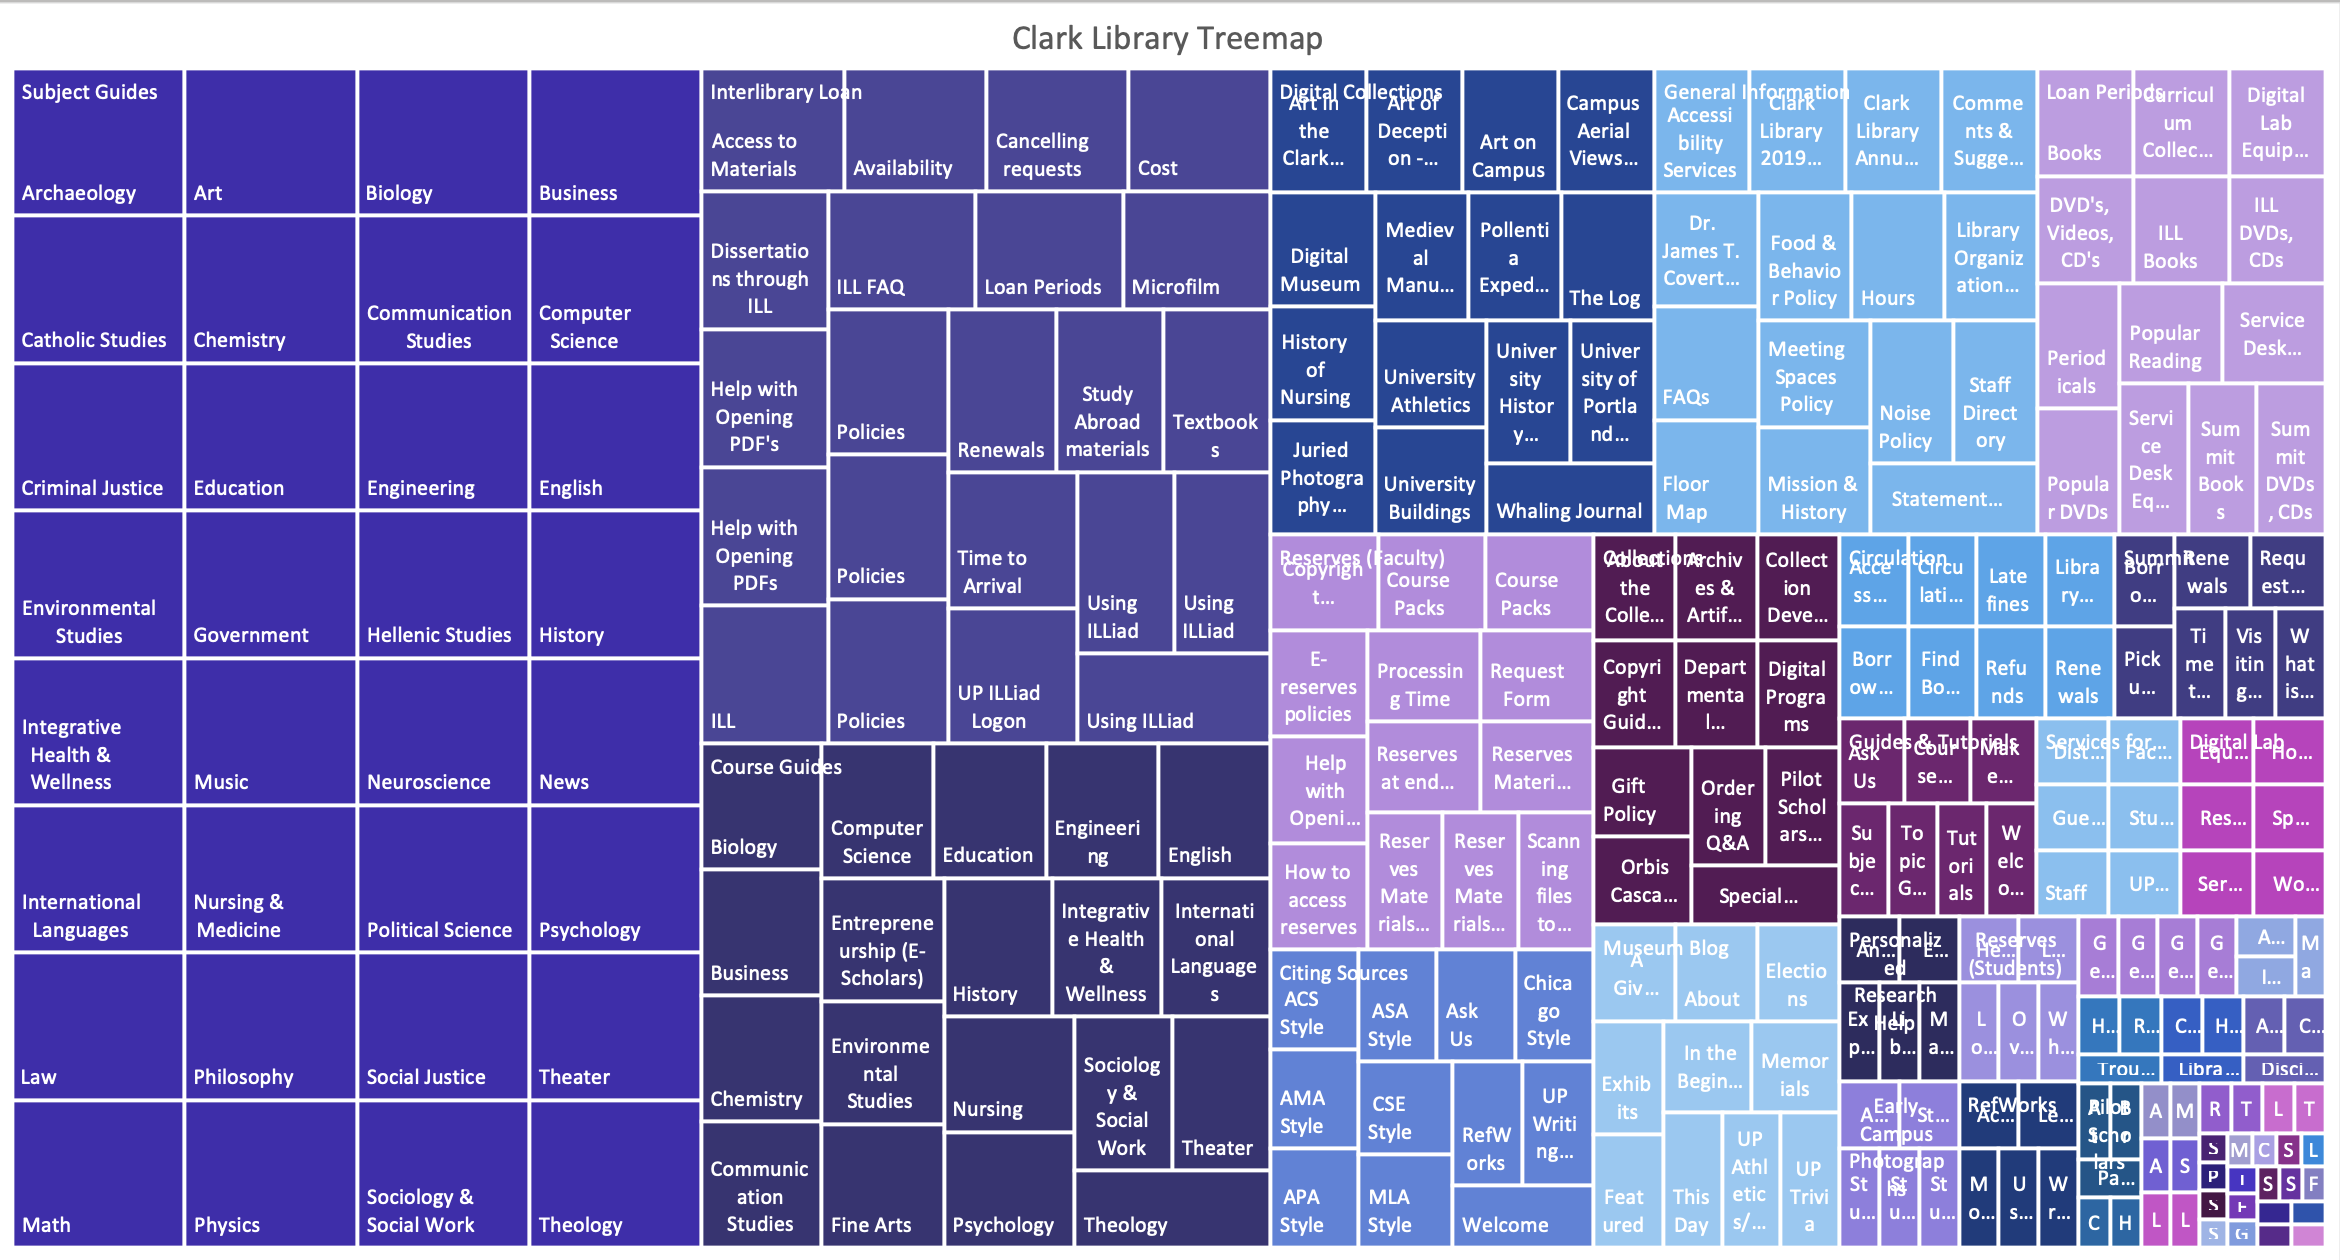
In order to create this treemap of the Clark Library, I began with the Clark Library Homepage. I identified all of the top-level content on the home page and transferred that data to an Excel spreadsheet. For each top-level item, I then determined the second-level or “child” data, and then each third-and-fourth-level or “grandchild” in order to create three tiers or levels of data. The majority of items had three levels, but some only had two, and some had four. To determine the level two, three, and four data, I analyzed the source code for clues; however, the source code did not use header tags consistently. In the end, I had to use my best judgement from the content and context of each webpage, relying on my knowledge of academic library websites such as the one I use as a reference assistant at URI's Carothers Library.
I controlled the vocabulary for each data point, using Level 1, Level 2, and finally relying on my own judgement to determine the best subject term for each cell. When the data was cleaned up to the best of my ability, I then sorted by level, and weighted each term, per the instructions for Lab 5. I then created a treemap using the charts in Excel, and adjusted the color palate. When it appeared satisfactory, I took a screenshot for this site. This static image is displayed below. Please use the magnifying glass to view larger.
(image by author)
In reflection, while Lab 5 involved a significant amount of tedious data mining, it also required much critical thinking. Treemapping the UP website was challenging because it isn’t as clear cut as the URI Libraries website. The organization was not clear at all for many of the levels. Some items were listed in several different categories, yet went to the same page; for instance, the Citing Sources LibGuide was implied to be a Tier 2 heading in having a location in the navigation menu, but it was also listed as a Tier 3 heading on the same “Get Help” page. While I have a baseline proficiency, my confidence in using Excel is still not where it should be, so having a reason to use it for this lab was much needed and appreciated, and the lesson video was of great assistance in showing me easier ways to manipulate the data than I would have used otherwise. I also greatly appreciated the required reading this week, as I use and even teach how to use the faceted search on the URI website, but the readings in Ding, et al (2017) really helped me understand facets at a deeper level. I am constantly surprised at how learning really is iterative.
