Treemap of Nashville Public Library Website
To make my treemap, I first added all of the headings in Google Sheets, but then decided it would be easier to use Excel to make the treemap. For Level 1, I used the information in the horizontal menu of the website, which included links to Books, Blogs, Events, etc. For Level 2, I intitially used the subheadings under each drop down menu (there were two to three in each) such as Audiences, Browse the Catalog, and Downloads and Streaming under the Books, Movies, and Music drop-down menu. Each subheading had links to different pages underneath them. I then realized this would not give me enough data for the treemap so I decided to include the subheadings as Level 2 then put the actual links that included titles such as Children, Teens, Adults, as Level 3, with the headings on each individual page as Level 4. To determine the Level 4 content, I chose the words that were in large orange font (such as From the Blog, or Browse Our Colletion, under Childrens) because the orange color signified their importance since this was part of the website's color scheme. After entering all my data, I looked to see if there was any information I could adjust in order to maintain a controlled vocabulary. There were a few instances where I altered the text, and a few where I did not want to change the text because I felt it would alter the semantic meaning.
After making my spreadsheet, I went to make my treemap but then realized that the version of Excel that I had did not have the option to make a treemap, or at least I could not figure out how to do it. Luckily I was able to open my data on a different computer with updated software and make my treemap.
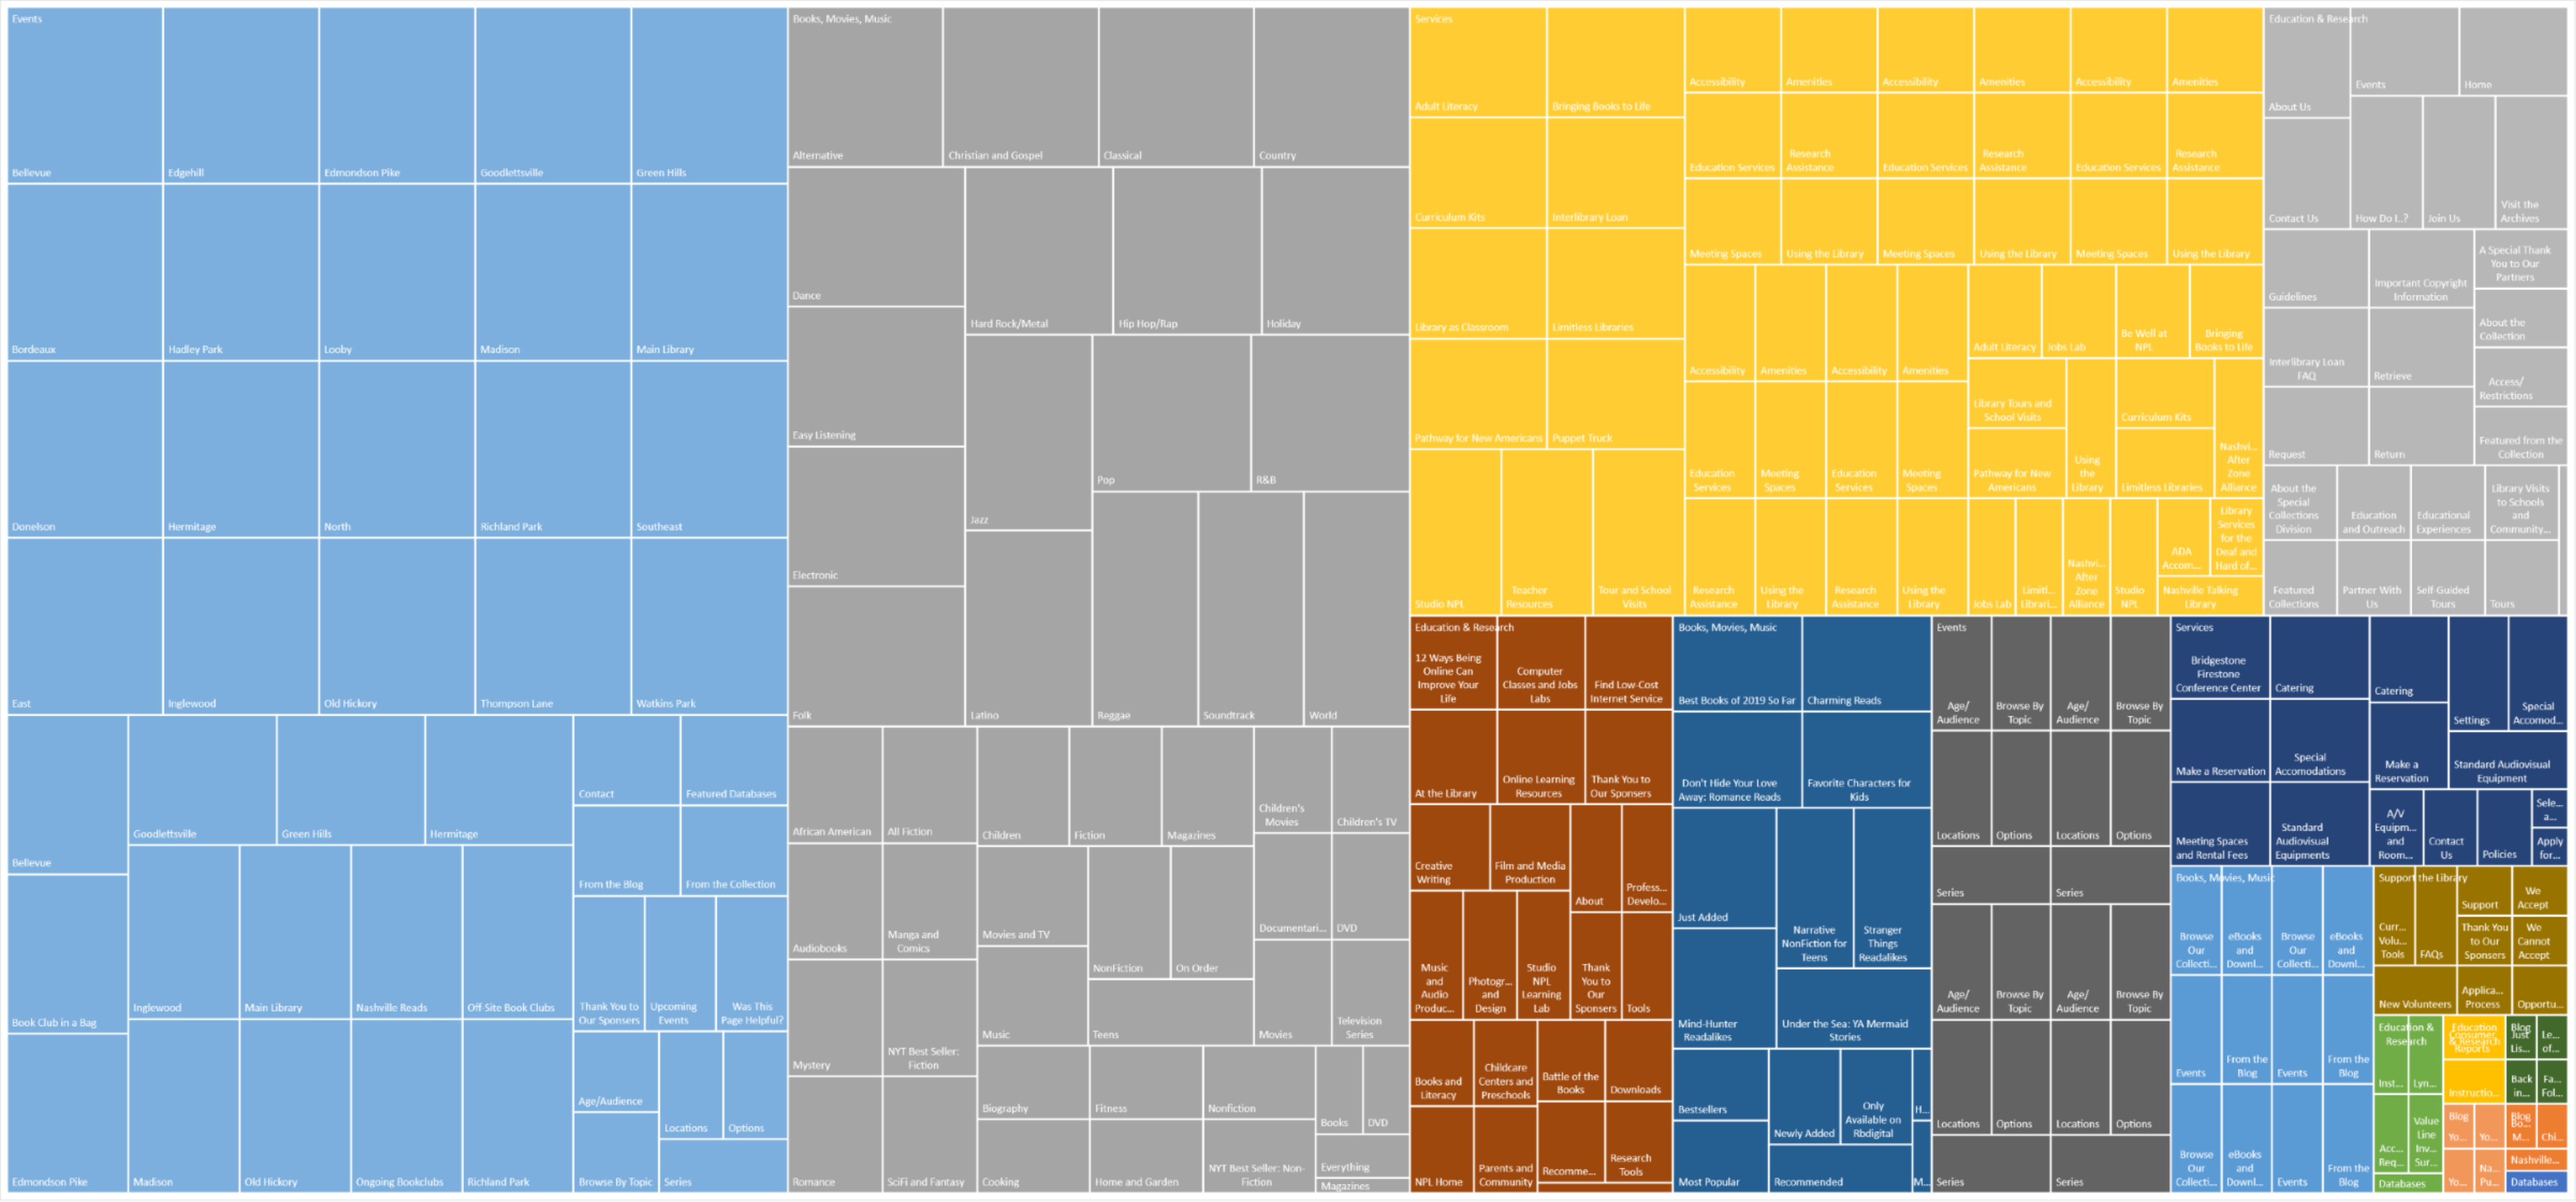
Lab 5 was definitely time-consuming, as Dr. Mandel warned us. I learned that there are different levels of information on websites and how to organize them. At first I was unsure which information to use as Level 2, but after watching the video tutorial again and seeing Dr. Mandel go from page to page and write down all the headings, I ultimately decided to go a step further and use four levels of content. I liked learning how to turn this data into a treemap. The visualization definitely made the information easier to understand. It is easy to see which levels have the most information based on the size of the squares. I did actually struggle with screenshotting the treemap in Excel, though. It was so large that the only way I could screenshot it was to zoom out really far. This made the image kind of blurry, but I think it was still clear enough that it could be read if zoomed in.
Lab 6 was surprisingly easy. I did not have any issues making the navigation page based on the instructions on the W3Schools website and Dr. Mandel's instructions. I did mess up my ordered and unordered lists on my comparison page at first, but was able to figure out what I did wrong and quickly fix it. Adding the active links was surprisingly easy as well. I enjoyed this lab!
Lab 7 was pretty straight forward. I had no problem creating a header and a footer using the div tag so that the header and footer stayed on all pages. Adjusting the width of the content was also a good idea because it makes for a more neat looking website. Being able to add and adjust the hover color of the navigation bar by pasting the code in the stylesheet was a lot easier than having to do it page by page. The hover feature makes it easier to see which link you are on.
In Lab 8 we learned how to use JavaScript. The tutorial in both the lesson and the W3Schools website were easy to follow. I definitely learned how important it was to use the correct lowercase and capital letters, etc, since JavaScript is case-sensitive. Also, when I was typing the mouseover codes I had to go back and revise a couple of times because I kept messing up the quotation marks. I like how the code is color-coded as it can usually alert you if there is an error in the code.